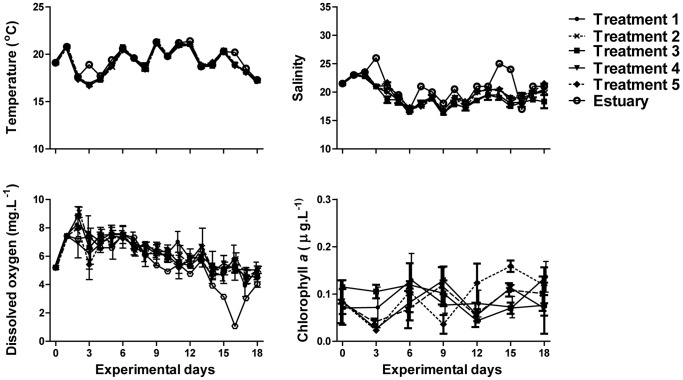
Figure 1. Physico-chemical measurements and chlorophyll-a concentrations over time.
Mean±standard deviation of temperature, salinity, dissolved oxygen and total chlorophyll-a concentrations over time, per experimental treatment and from the estuarine waters at the experimental site. Temperature, salinity and dissolved oxygen measurements recorded daily. Chlorophyll-a samples collected every third day.

