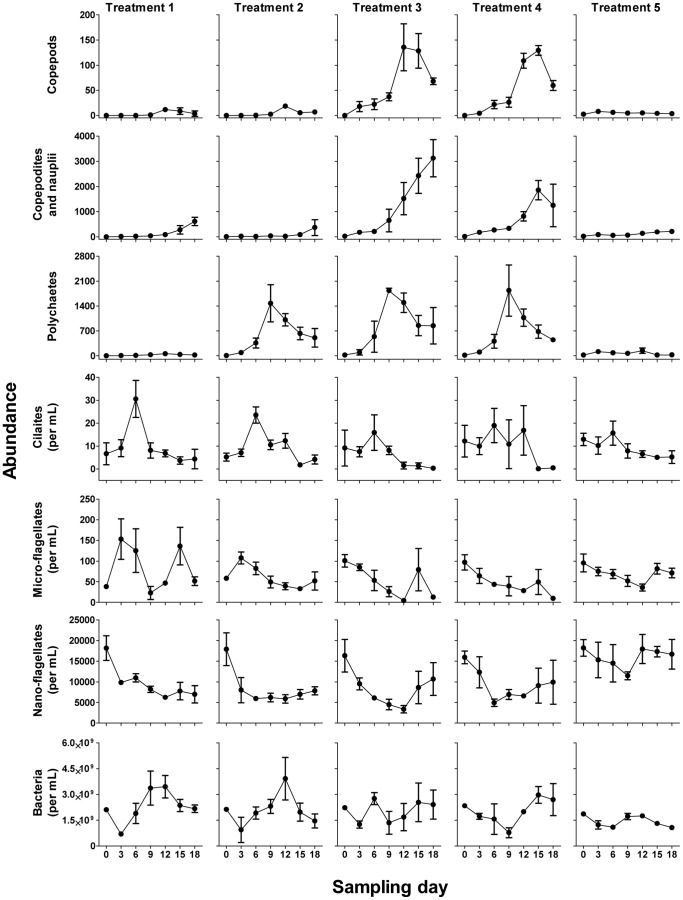
Figure 2. Taxon abundances over time.
Bacteria, flagellate and ciliate values are expressed as numbers per mL, whereas polychaete, copepodite and nauplii and copepod values are expressed as numbers per sample (26.43 L). Mean±standard deviation of abundances calculated from three replicates per treatment.

