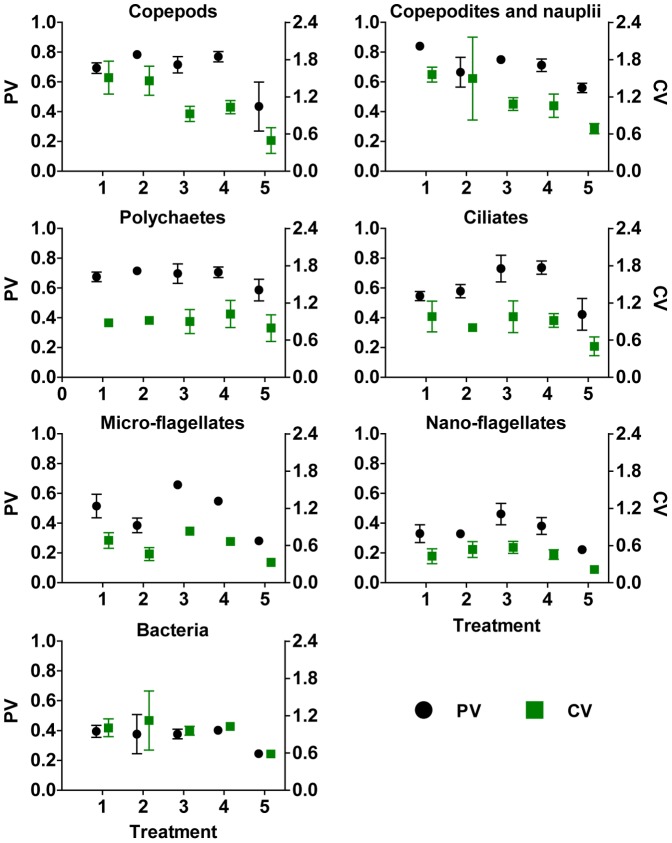
Figure 3. Comparison of the proportional variability (PV) and coefficient of variation (CV) for each taxon.
Mean±standard deviation of overall PV and CV calculated from three replicates per treatment. For PV (left y-axis), 0 = complete stability, 1 = complete instability; CV (right y-axis) has no upper bound.

