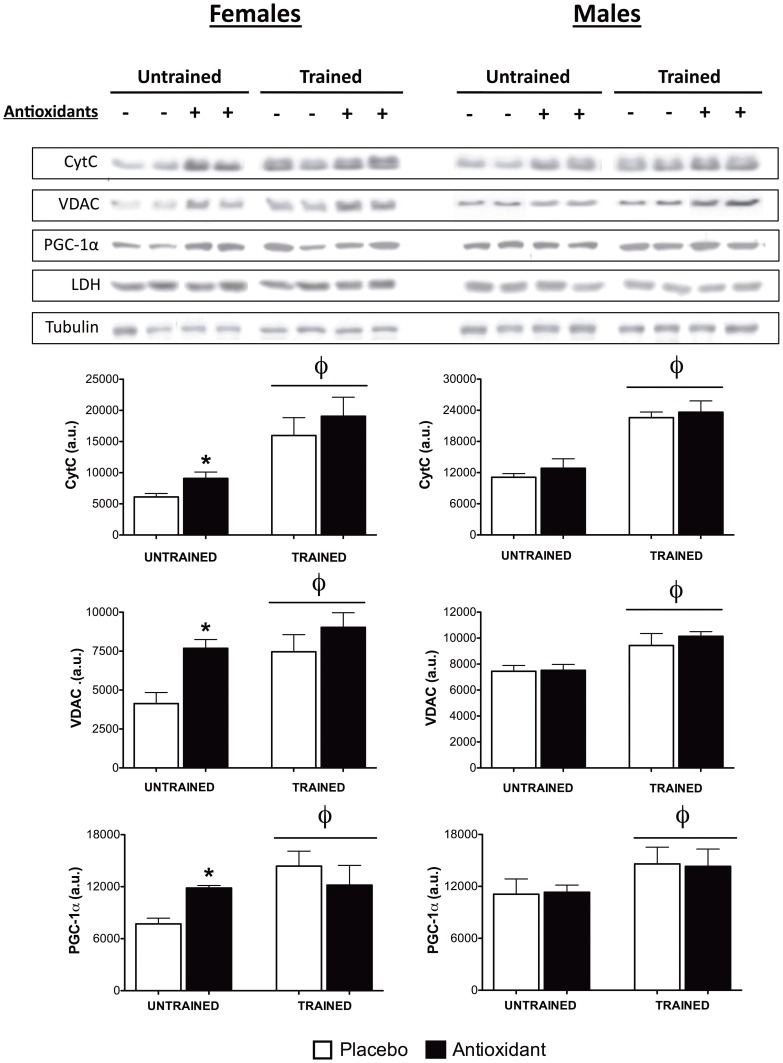
Figure 3. Expression of mitochondrial proteins and PGC-1α.
Expression of mitochondrial proteins and PGC-1α were determined using Western blotting on protein homogenates prepared from tibialis anterior muscle tissue (n = 4–6 mice/gender/group). Data are means ± SEM and representative bands from each gender and group are shown. φ indicates main effect of training, p≤0.05, and post-hoc testing was used to compare antioxidant- and placebo-supplemented groups, * indicates p≤0.05.

