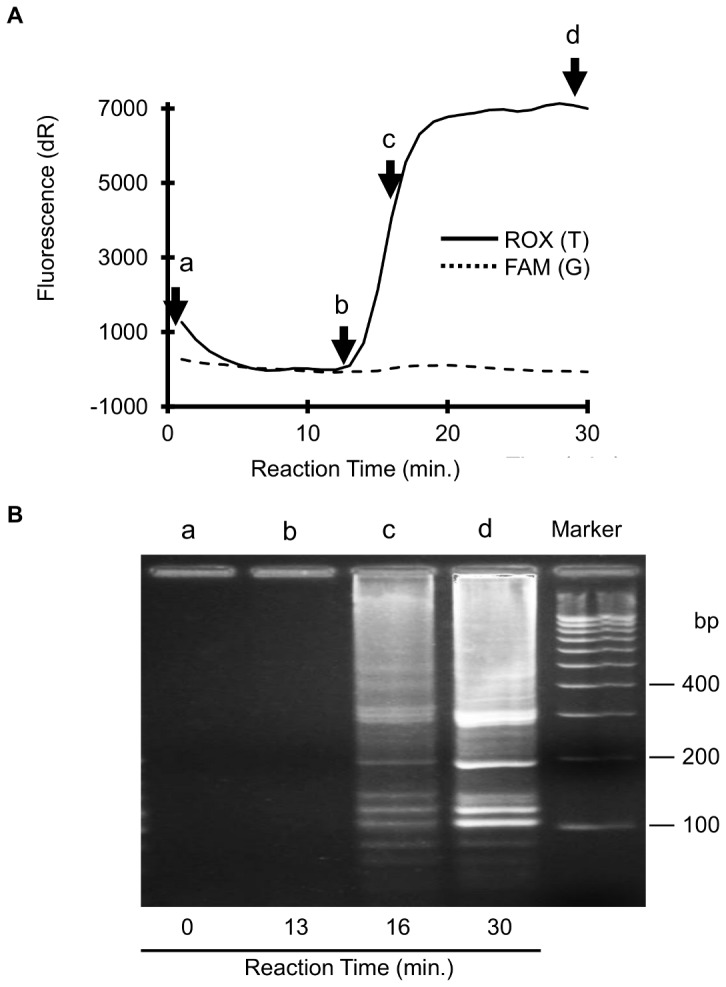
Figure 4. Analysis of DNA products formed in the Duplex SmartAmp reaction.

A: Time course of typical Duplex SmartAmp reaction by real-time monitoring. B. Agarose gel electrophoresis of DNA products after Duplex SmartAmp reaction. We sampled aliquots of reaction mixtures at different reaction times (t = 0, 13, 16 and 30 minutes) and separated DNA products by agarose gel electrophoresis. The “Maker” represents a 100-bp DNA ladder.
