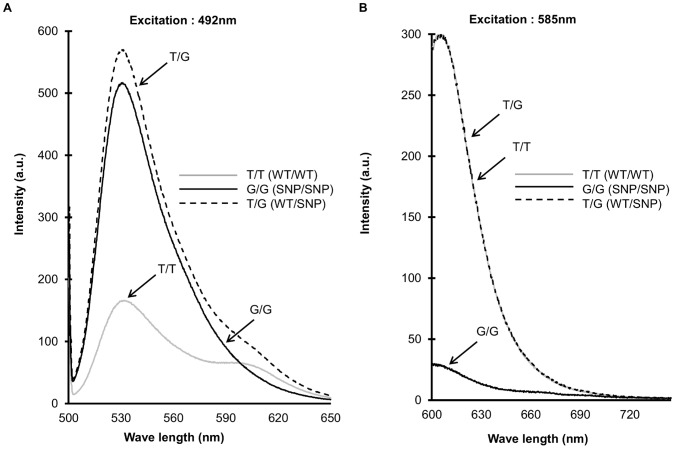
Figure 5. Fluorescence spectra of amplified products.
The fluorescence spectra of amplified products were measured with excitation at 492 nm (A) and 585 nm (B) for oBP(SNP) and oBP(WT), respectively. The grey line, black solid line, and dotted line represent the fluorescence spectra of the amplification products of T/T (WT/WT), G/G (SNP/SNP), and T/G (WT/SNP), respectively.

