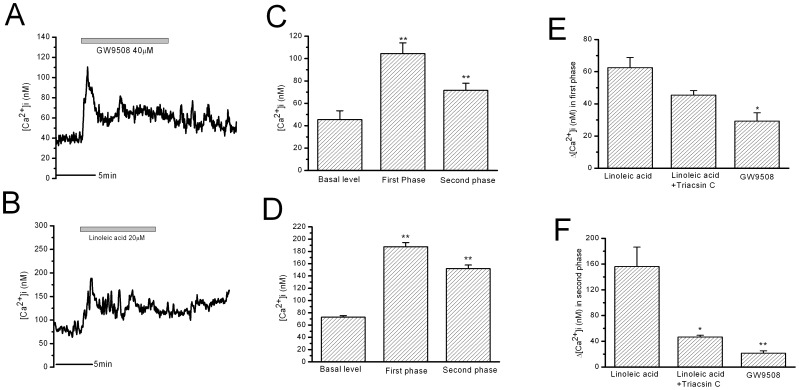
Figure 2. The increase in [Ca2+]i in rat β-cells stimulated by GW9508 and stimulated by LA after Triacsin C treatment.
A: GW9508-induced increase in [Ca2+]i in 10 minute stimulation. B: 10 min LA-stimulated increase in [Ca2+]i after Triacsin C treatment. C and D: the statistical results of the maximal Ca2+ levels in the first phase and in the second phase of A and B, respectively. ** means P<0.01 vs basal level. E: The mean Ca2+ changes in the first phase. * means P<0.05 vs LA. F: The mean Ca2+ changes in the second phase. ** means P<0.01 vs LA (n = 7 for GW9508 and Triacsin C).

