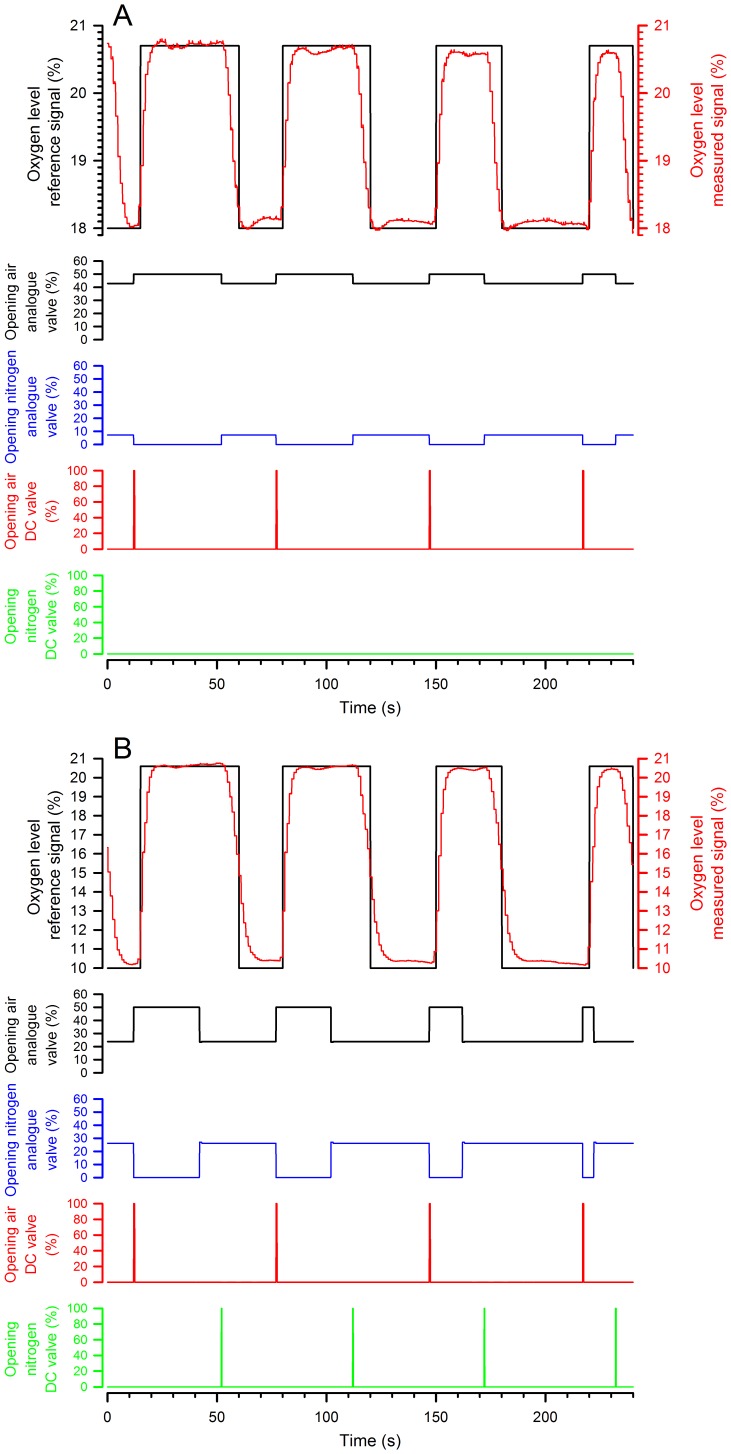
Figure 2. Control of the DC and analogue valves as a function of the required FIO2.
The traces illustrate the strategy used when the required FIO2 was between 21%-13% (here 18%, A) or 12-0% (here 10%, B). The first graph corresponds to traces of expected and measured gas concentrations, and the others to the operating signals controlling the valves.

