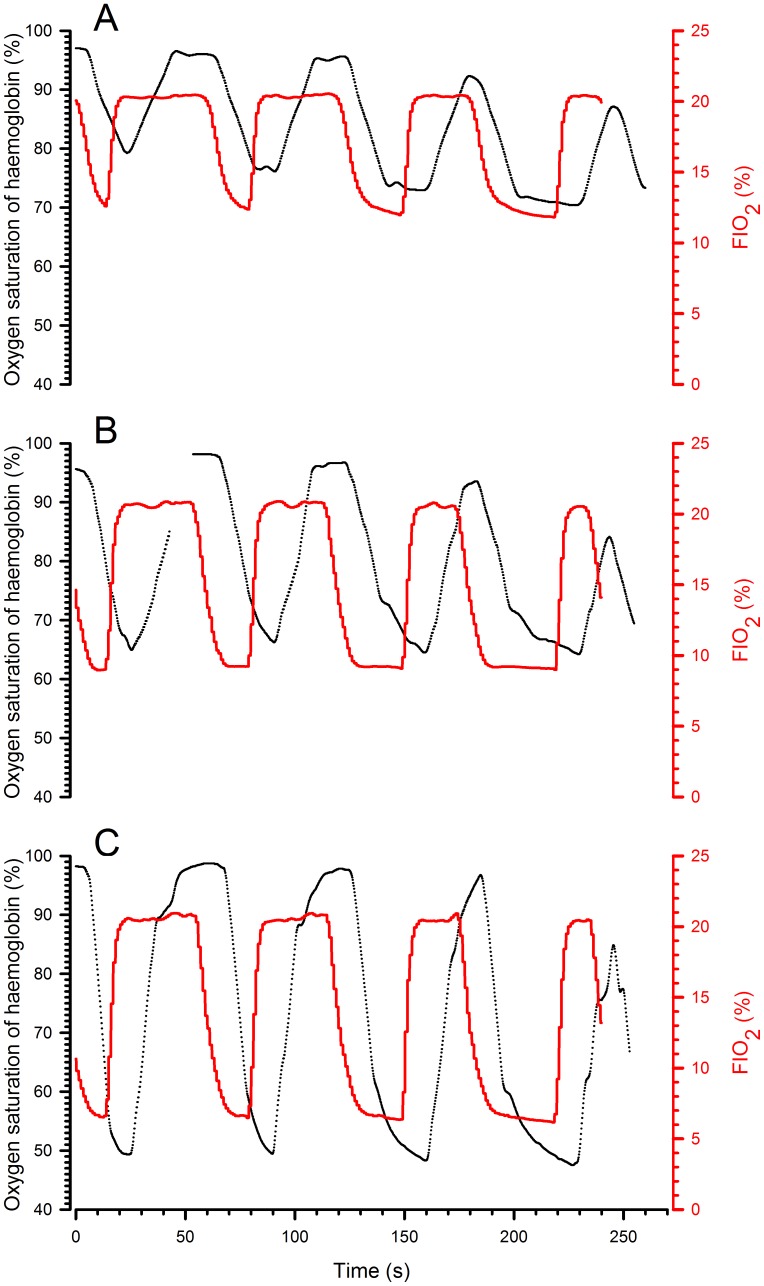
Figure 5. Representative records of haemoglobin oxygen saturation during hypoxia–reoxygenation with different durations of the hypoxic phase.
During the four consecutive 60 s cycles, the hypoxic phase was progressively lengthened (15, 20, 30 and 40 s). The black line corresponds to the oxygen saturation of haemoglobin, the red line to FIO2 in the inspired air. The three graphs represent the cycles with different FIO2 values during the hypoxic phase (A: 12%; B: 9%; C: 6%).

