
Figure 2. Collapse of the Trigger Factor.
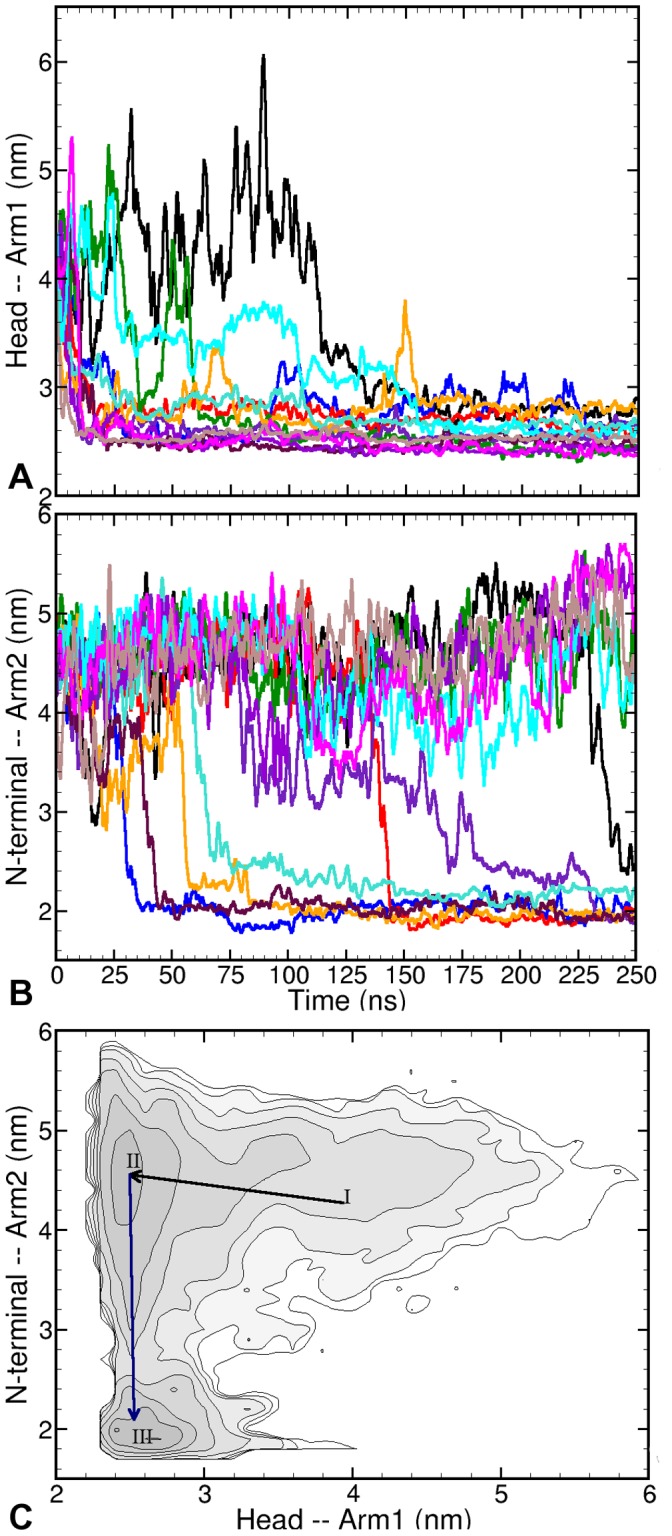
Time traces of pair-wise centre of mass distances between: (A) Head and Arm1, and (B) N-terminal and Arm2, show that in nearly all the trajectories the respective separation between pairs of domains is consistently reduced; (C) Logarithmic probability histogram plot for pair-wise COM distances – HA1 vs NtA2– shows three regions corresponding to: initial extended structure (I), semi-collapsed collapsed (II), and the fully collapsed. Contours are  apart. Note that this plot does not represent an equilibrium free energy landscape, as the simulations are not converged.