
Figure 1. Mean food intake and S.E.M. of control, ARP, AAP, FRP and FAP rats during the day (white bars) and during the night (gray bars) during the fourth week of manipulation.
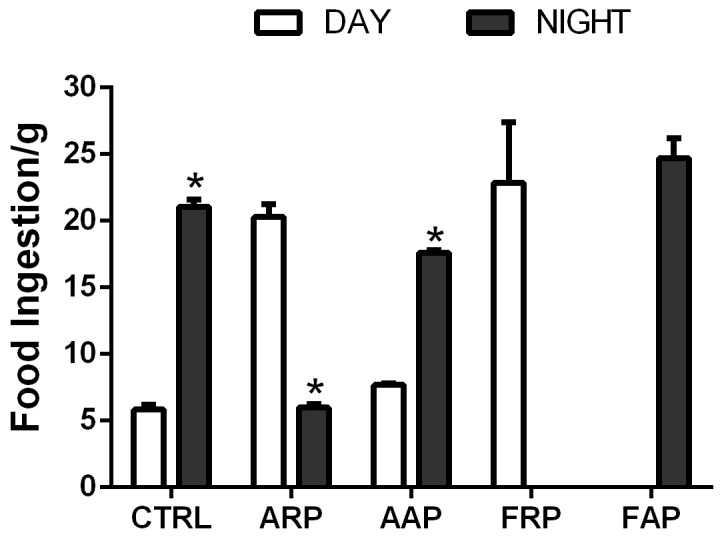
Asterisks indicate statistical difference between day and night values (P<0.05).