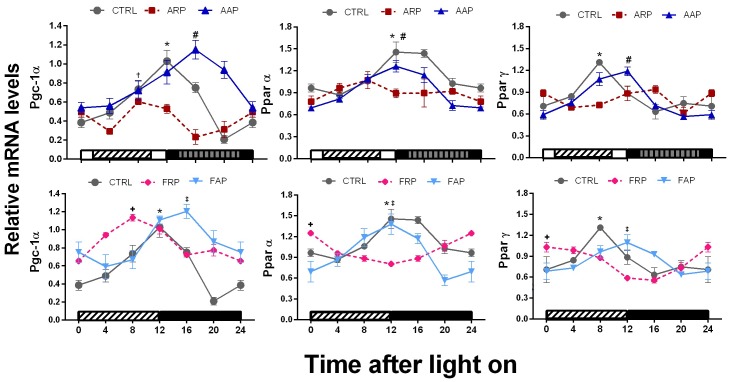
Figure 8. PGC-1α and Ppar genes show a loss of rhythm and are down regulated when rats eat during the rest phase.
Relative expression levels of Pgc-1α, Pparα and Pparγ mRNA in liver of CTRL, ARP, FRP, AAP and FAP rats, during the 24-h LD cycle (n = 3–4 per time point). Each value represents the mean ± SEM. Other indications as in Fig. 5.

