
Figure 3. SMA-MAP motor function score prediction model.
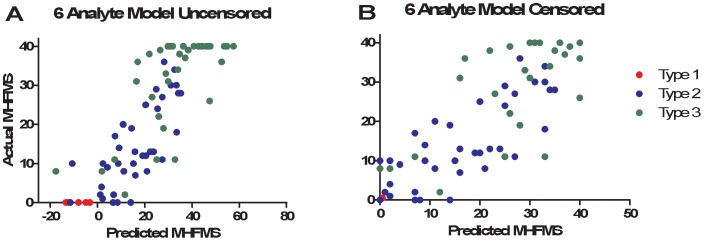
Using Tobit linear regression models SMA motor scores were predicted from SMA-MAP analytes values with age of onset as a covariable. Pearson correlations between actual and predicted motor scores for the top 6 combinations from BforSMA were plotted. A: Graph of actual and predicted motor scores of a 6 analyte model uncensored model. Type 1 SMA patients and ambulatory Type 3 subjects can be represented in the analysis and given a score below 0 or over 40 respectively. B: Graph of 6 analyte motor scores using values censored between 0 and 40. Note that the Type 1 datapoints have been moved arbitrarily to the right to allow visualization, and these points still represent values of 0.