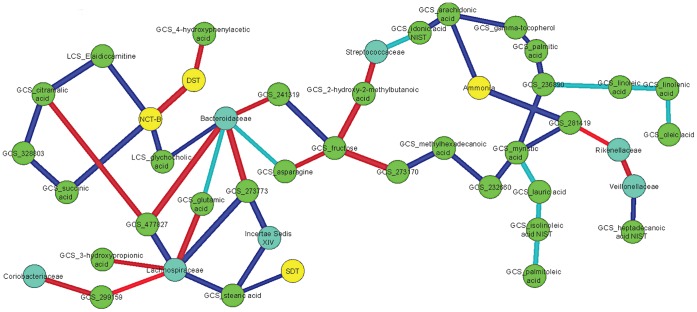
Figure 5. Subset of correlation differences before and after rifaximin.
This figure is limited to the metabolomics and clinical/cognitive features that changed with rifaximin and their interaction with the bacterial taxa. The linkages that significantly changed in nature (positive to negative or vice-versa) or intensity (less to more or vice-versa while remaining positive or negative) with p<0.05 are shown. Nodes: Blue: bacterial taxa, green: serum metabolites, Yellow: cognitive or clinical data. Linkages were dark blue if correlations were positive before and changed significantly to negative, light blue if they changed significantly but remained positive throughout, red if correlations were negative at baseline but changed to positive after therapy and green is negative relationship throughout but a significant change.

