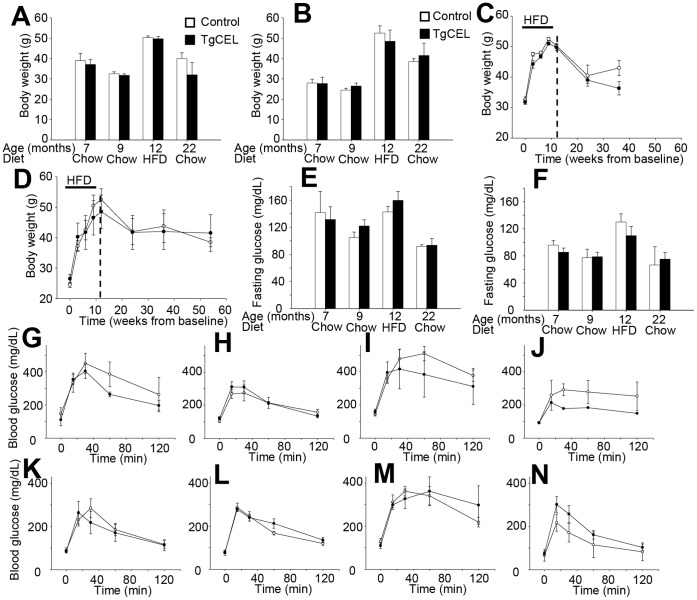
Figure 2. Weight and glucose homeostasis in TgCEL and control mice.
Controls, white bars or open circles; TgCEL mice, black bars or filled circles. Results are given as mean ± SEM. Tail or hind leg vein blood was drawn in after an overnight fast and glucose was measured by glucometer. The characteristics were assessed in chow-fed mice at 7 and 9 months of age, at 12 months of age following 12 weeks on a 60% HFD (all tests: n = 4 [males] and n = 5 [females]), and at 22 months of age in mice that had been chow-fed after the HFD challenge (n = 2 controls, 1 TgCEL [males] and n = 3 controls, 5 TgCEL [females]). There were no statistical differences in body weight between male (A) and female (B) mice. Body weights increased during a 12-week challenge with a 60% HFD, but there were no differences in body weight development between TgCEL and control mice in male (C) and female mice (D). Fasting blood glucose levels also increased after 12 weeks of HFD but there were no differences in fasting blood glucose levels between TgCEL and control mice at any age in male (E) and female mice (F). A glucose tolerance test was performed in male mice (G, H, I, J) and female mice (K, L, M, N) after a 12–14 hr fast by i.p. injection of glucose (2 g per kg bodyweight). The test was performed in chow-fed mice at 7 months (G, K) and 9 months (H, L) of age, at 12 months (I, M) of age following 12 weeks of a 60% HFD. Although the 60% HFD increased glucose intolerance compared to baseline (9 months), there were no differences between TgCEL mice and controls in any of the groups.

