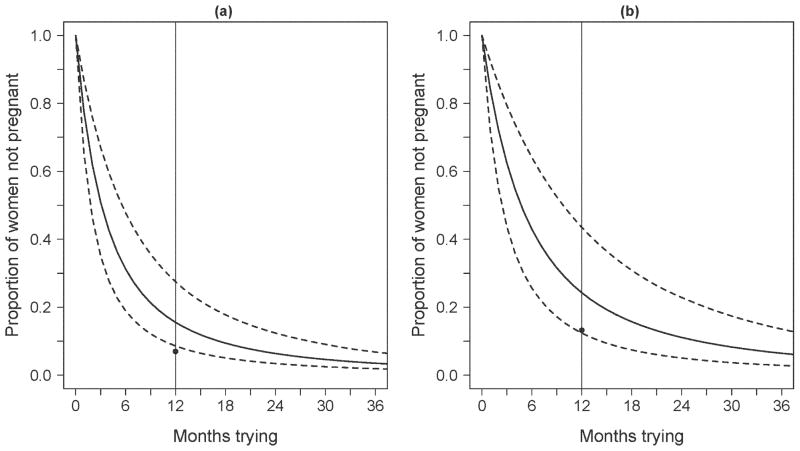
Figure 2.
Estimation of the proportion of women not yet pregnant as a function of the number of months trying for pregnancy among (a) all women (n = 270) and (b) nulliparous women (n = 139) who reported currently trying and their duration of pregnancy attempt. The solid curve is the survival function for the time until pregnancy or end of attempt and the dotted curves indicate 95% confidence intervals (CI). The solid vertical line at 12 months corresponds to infertility estimates of (a) 15.5% (95% CI: 8.6, 27.5) and (b) 24.3% (95% CI: 12.4, 43.5) for the current duration approach. The corresponding infertility estimates represented by black circles are (a) 7.0% (95% CI: 6.2, 7.8) and (b) 13.2% (95% CI: 11.2, 15.2) based on the constructed measure.

