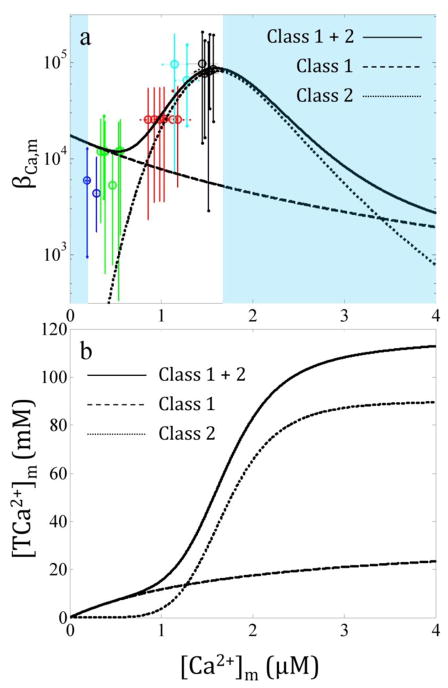
Fig. 2. The mitochondrial Ca2+ buffering power increases as the Ca2+ load increases for isolated cardiac mitochondria from guinea pig.
The data from our companion paper [7] were used to compute the Ca2+ buffering power as described in the Methods section (a). The colors correspond to the following CaCl2 boluses: blue, 0 μM; green, 10 μM; red, 20 μM; cyan, 30 μM; and black 40 μM. The solid line is the minimal model defined in Eq. 13. The dashed and dotted lines correspond to the contribution of the class 1 and 2 buffers to the Ca2+ buffering power, respectively. The shaded regions indicate where the mitochondrial Ca2+ buffering power cannot be estimated from the data. The total sequestered Ca2+ predicted by the Ca2+ sequestration system demonstrates that after 120 mM total Ca2+, the buffering system is near maximum capacity (b). At high Ca2+ loads, the vast majority of Ca2+ buffering is from the class 2 buffers.

