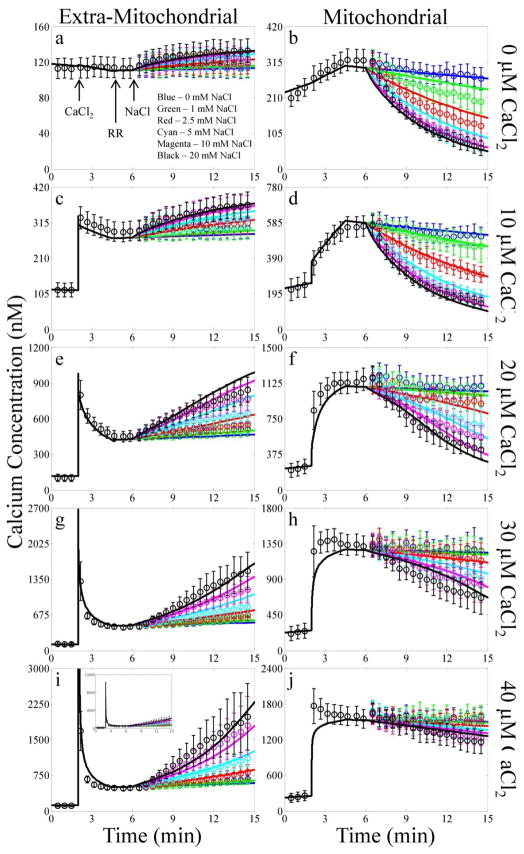
Fig. 3. Experimental data compared with model simulation results of the CaCl2 and NaCl bolus combinations.
The simulation results of each bolus CaCl2 addition are plotted by row with the extra-mitochondrial (left) and mitochondrial (right) Ca2+ concentrations plotted by column. The color of each line corresponds to the following NaCl boluses: blue, 0 mM; green 1 mM; red, 2.5 mM; cyan, 5 mM; magenta, 10 mM; and black, 20 mM. The times that reagents were added to the mitochondria are indicated by the arrows. Due to Ca2+ contamination present in the mitochondrial suspension, the extra-mitochondrial free Ca2+ concentration reaches approximately 10 μM for the 40 μM CaCl2 bolus addition as shown by the inset in panel G. To account for experimental variability in a few cases when simulating the experiments, the mitochondrial load, EGTA concentration and/or CaCl2 bolus concentration were allowed to vary +/−15%.

