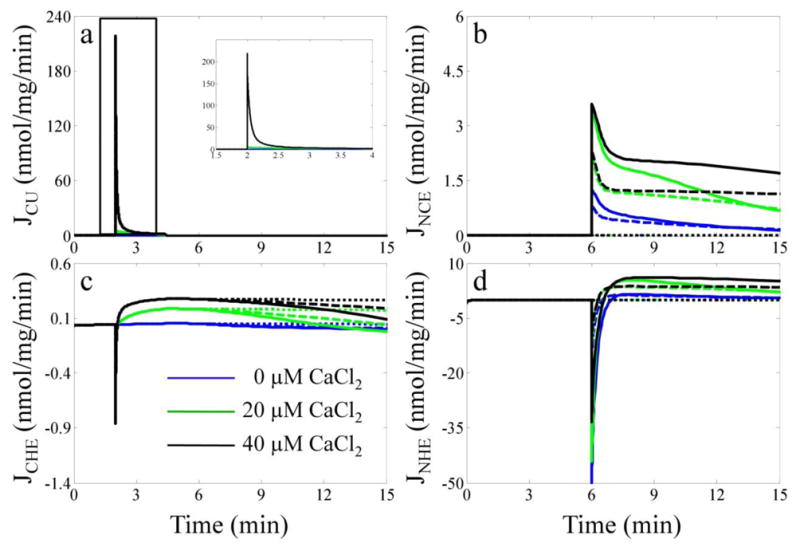
Fig. 5. Model predictions of the Na+/Ca2+ cycle related fluxes.

The simulated fluxes for the CU (a), NCE (b), CHE (c) and NHE (d) are plotted for selected CaCl2 and NaCl bolus combinations. The color and style of each line correspond to the same scheme of CaCl2 and NaCl bolus combinations given in the legend of Fig. 4.
