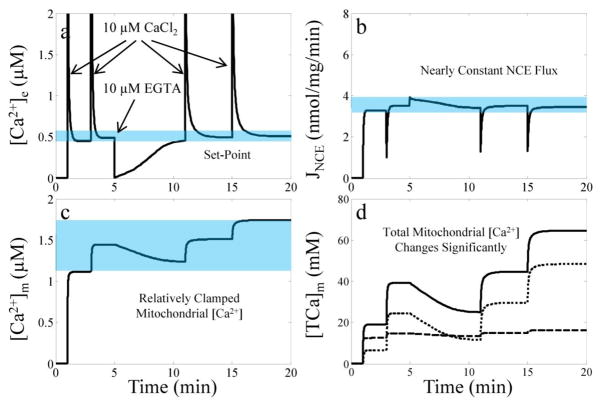
Fig. 6. Simulation results of the set-point phenomenon.
Simulated [Ca2+]e (a), NCE flux (b), [Ca2+]m (c) and [TCa2+]x (d) dynamics are plotted for the simulation of the set-point protocol. The blue regions highlight the origin of the phenomenon – nearly constant NCE flux due to a relatively clamped [Ca2+]m regardless of [TCa2+]x. For the simulations, matrix pH is initialized to 7.15 by increasing the [K+]x to 140 mM to facilitate Ca2+ extrusion by the NCE. The mitochondrial load is 0.5 mg/ml. In panel D, the dashed and dotted lines are the contribution to total Ca2+ of the class 1 and class 2 buffers, respectively.

