
Fig. 7.
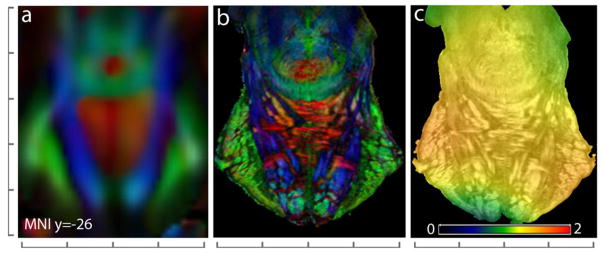
Co-registration of the high-resolution ex vivo brainstem DTI data to the JHU in vivo brain atlas (Oishi et al., 2011). A representative coronal section (y = −26 mm in MNI coordinates) through the in vivo atlas (a) and the corresponding co-registered section from the ex vivo data (b) show the degree of registration accuracy. The color-coded map of the Jacobian determinant overlaid on the anatomical image (c) represents the local volumetric scaling applied by the transformation to warp the ex vivo data to the in vivo atlas. In the Jacobian map, values greater than 1 represent local expansion, and values less than 1 represent local volumetric contraction of the ex vivo image under the deformation. Scales shown are in units of mm with 10 mm spacing.