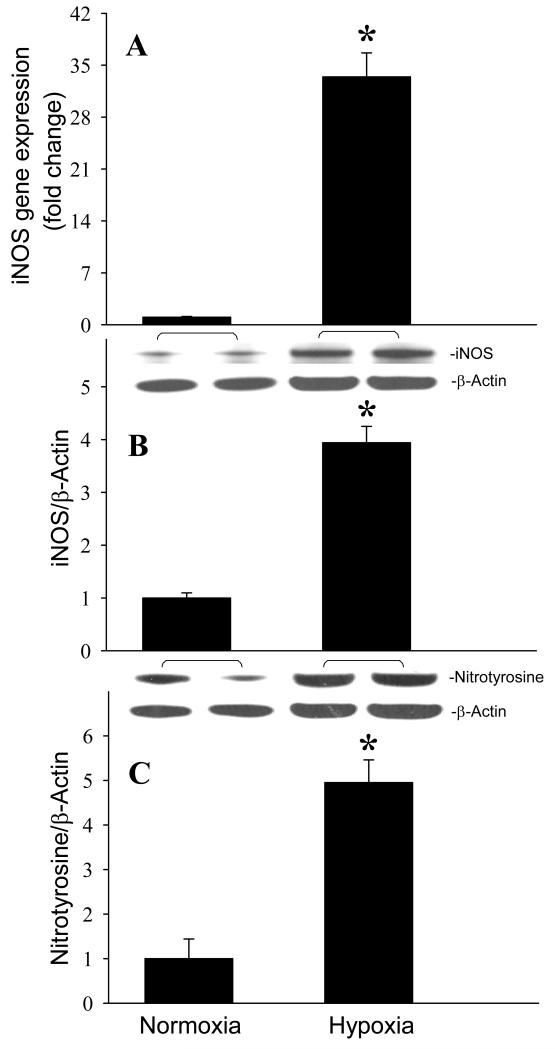
Fig. 7.
Induction of iNOS and nitrotyrosine expression in microglia after exposure to hypoxia. BV2 cells cultured in normoxia or exposed to hypoxia for 20 h were harvested for analysis. (A) iNOS gene expression level was determined by real-time RT-PCR analysis. (B) iNOS and (C) nitrotyrosine protein levels were determined by Western blotting measurements. Representative blots against iNOS, nitrotyrosine, and β-actin are shown. Blots were scanned and quantified with densitometry. The levels of gene and protein expression in normoxia are designated as 1 for comparison purposes. Data are expressed as means ± SE (n = 4-5) and compared by Student-t test. *P < 0.05 vs. Normoxia.

