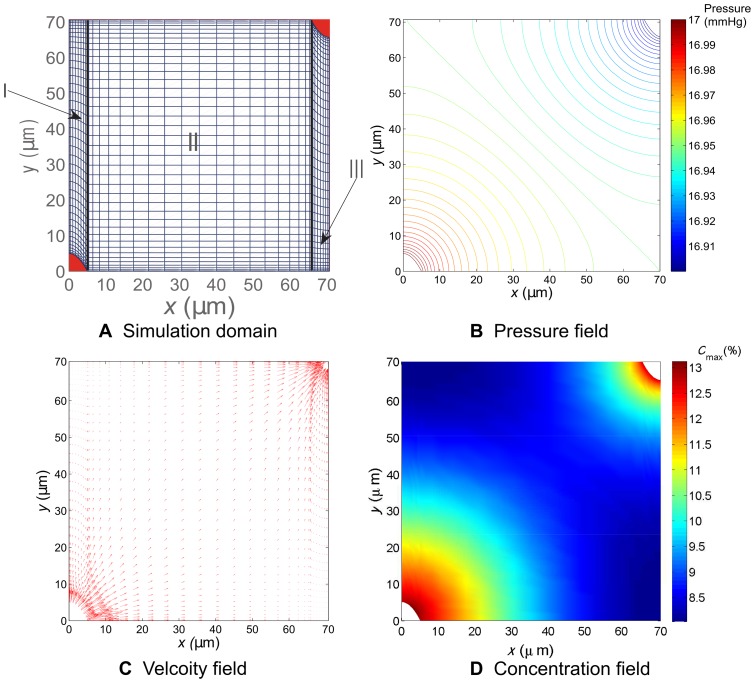
Figure 2. Illustration of the simulation domain and the computed pressure, velocity and concentration fields.
Illustration of the simulation domain and the computed pressure, velocity and concentration fields. Subfigure A illustrates sub-domains I, II, and III, and their meshes for  m. Subfigures B and C are the computed pressure and velocity fields, respectively. D. The concentration distribution for
  m at 100 min.

