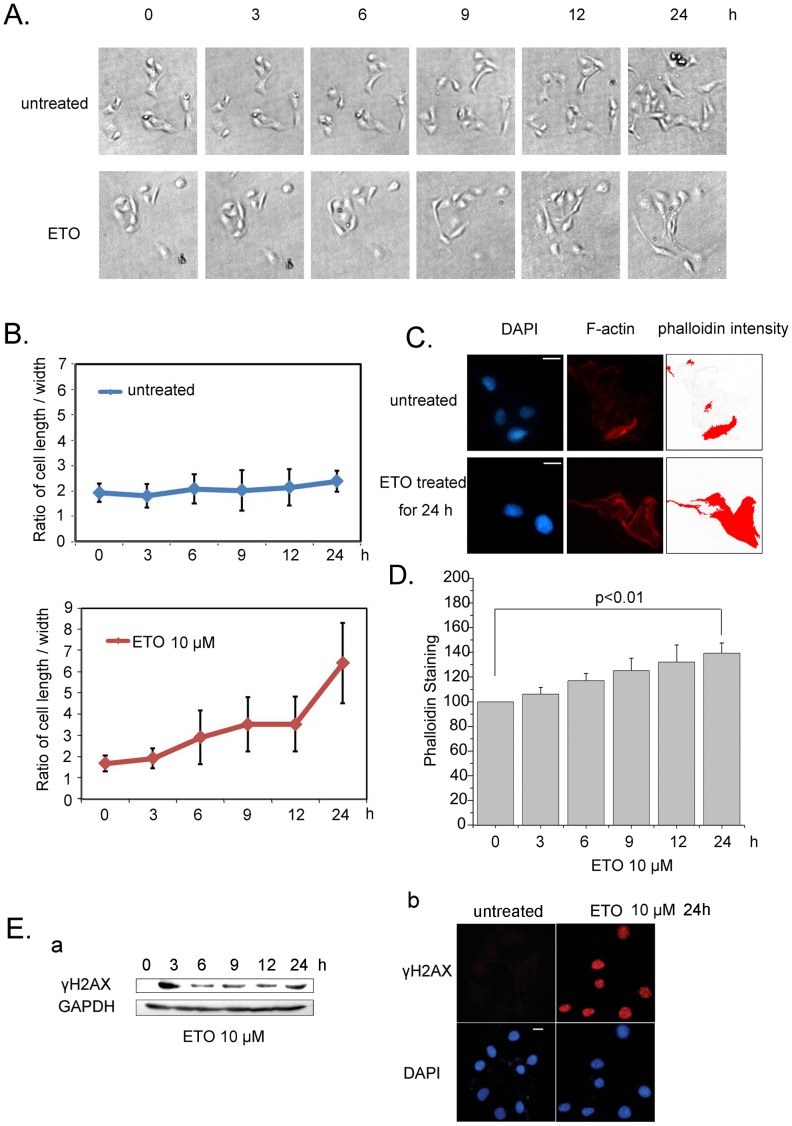
Figure 1. Actin polymerization increases in response to DNA damage.
A. U2OS cells were treated with ETO (10 µM) or untreated as control for 24 h, and images were captured at the indicated time points. B. The cell length and width were analyzed with Image J software in ≥100 cells per condition. C. U2OS cells were treated with ETO (10 µM) or untreated as control for 24 h, the intensity of phalloidin was measured with Image Pro Plus software. Scale bar, 10 µm. D. U2OS cells were treated with ETO (10 µM) or untreated as control for 24 h, and fluorescence assays were performed with a fluorescence microplate reader to measure cellular F-actin levels (phalloidin intensity/DAPI intensity). E. Cells were treated with ETO (10 µM) at indicated time points, and then whole cell extracts were analyzed by western blotting using anti-γH2AX antibody (a). U2OS cells were treated with ETO (10 µM) or untreated as control for 24 h. Then, immunofluorescence was performed to detect the signal of γH2AX (b). Scale bar, 10 µm. All Statistical differences were determined by One-way ANOVA. Results are presented as means ± SD of values from three independent experiments. ETO, etoposide.

