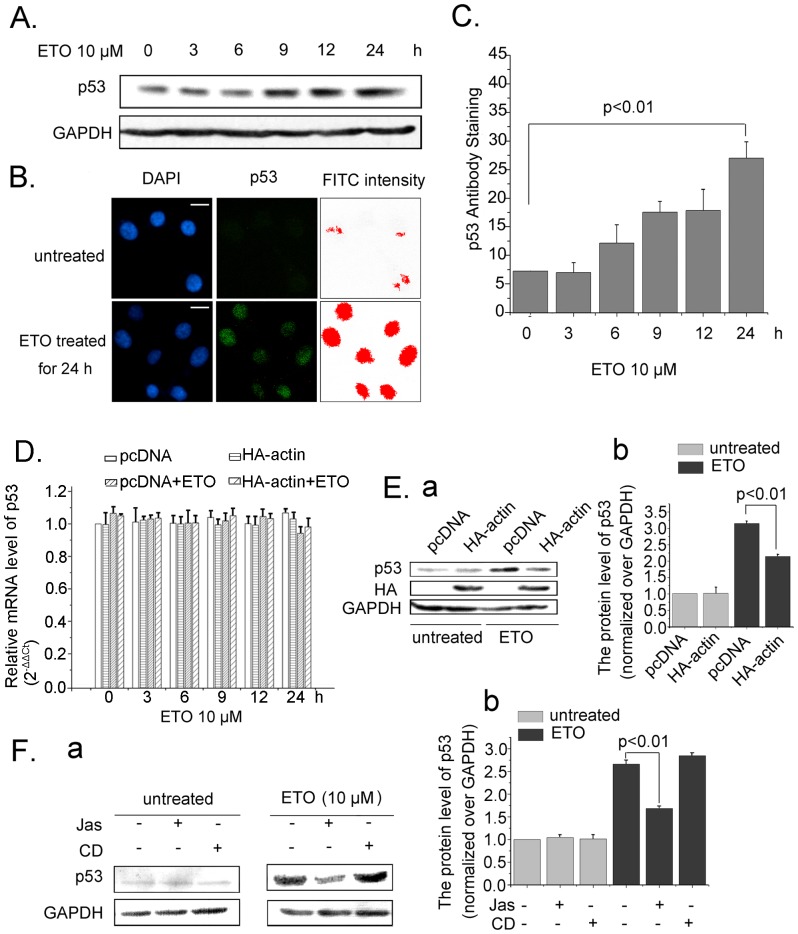
Figure 2. Actin polymerization modulates p53 cellular accumulation.
A. U2OS cells were treated with ETO (10 µM) or untreated as control for 24 h, cells were harvested and the whole cell proteins were extracted for western blotting to measure p53 protein levels. B. U2OS cells were treated with ETO (10 µM) or untreated as control for 24 h, the intensity of FITC staining p53 was measured with Image Pro Plus software. Scale bar, 10 µm. C. U2OS cells were treated with ETO (10 µM) or untreated as control for 24 h, and fluorescence assays were performed with a fluorescence microplate reader to measure cellular p53 levels (FITC intensity/DAPI intensity). D. U2OS cells were transfected with HA-actin or pcDNA, then treated with ETO (10 µM) or untreated as control at indicated time points. The cells were harvested, RNA extraction and Real Time-PCR were carried out. The mRNA content of p53 was normalized to that of GAPDH and the normal cells’ mRNA level was valued as 1. Data (mean±SD) were from three independent experiments. E. U2OS cells transfected with HA-actin were treated with ETO (10 µM) or untreated as control for 12 h. Whole cell proteins were extracted and western blotting was performed. F. U2OS cells were treated with Jas (50 nM) or CD (0.01 µg/ml) for 2 h to change actin dynamics, then treated with ETO or not. Cells were harvested, and whole cell proteins were extracted for western blotting to detect p53 protein levels in different conditions (a). Results were analyzed with Image J software (b). All Statistical differences were determined by One-way ANOVA. Jas, Jasplakinolide; CD, Cytochalasin D.

