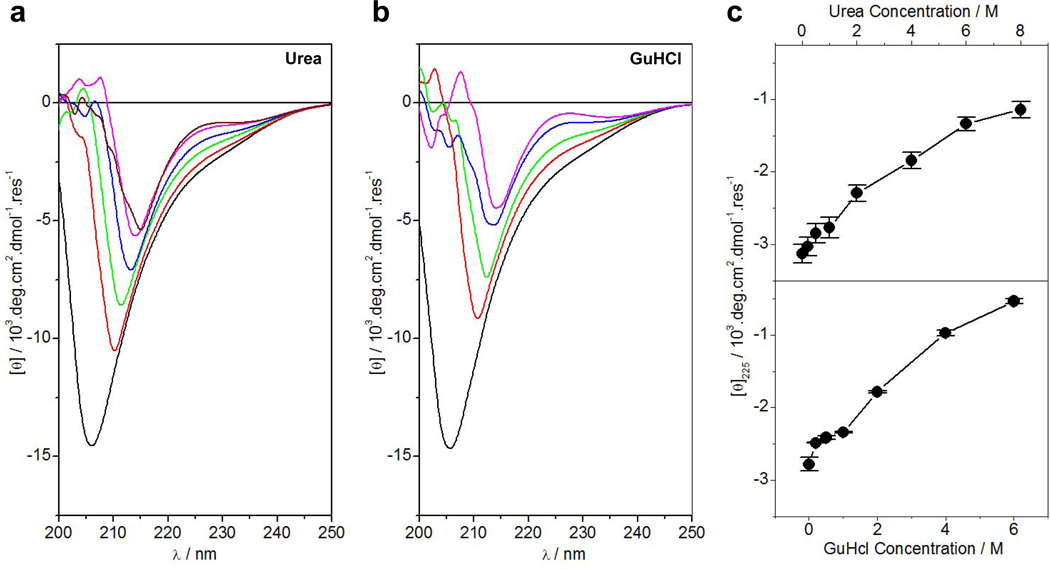
Figure 3.
CD analysis of the PR domain of Sos1 alone and in the presence of chemical denaturants. (a) Far-UV CD Spectra of the PR domain in 0M (black), 1M (red), 2M (green), 4M (blue), 6M (magenta) and 8M (brown) urea. (b) Far-UV CD Spectra of the PR domain in 0M (black), 1M (red), 2M (green), 4M (blue) and 6M (magenta) GuHCl. (c) Dependence of ellipticity of the positive band at 225nm, [θ]225, of the PR domain on urea (top panel) and GuHCl (bottom panel) concentrations. Error bars were calculated from three independent measurements to one standard deviation. The solid lines connect appropriate data points for clarity.

