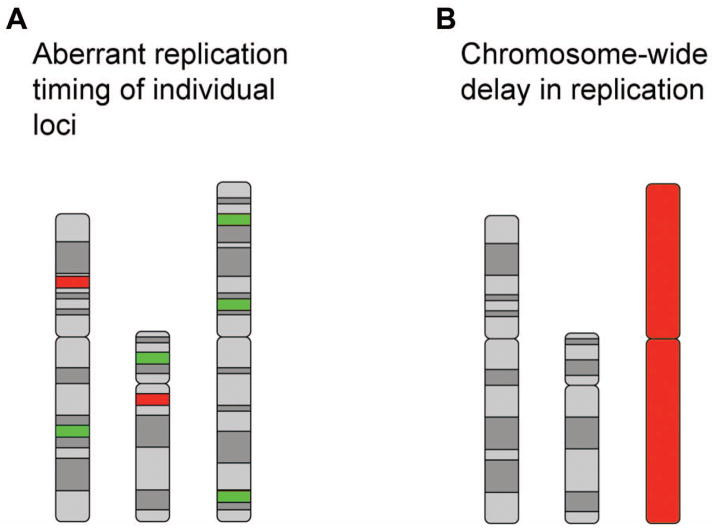
Figure 1.
Acquired alterations in DNA replication timing in cancer cells. A) Examples of individual loci that display a shift in replication timing. Loci that shift to an earlier time of replication are indicated in green, and regions that shift to a later time of replication are indicated in red. Three different chromosomes are shown. B) An example of an individual chromosome with a chromosome-wide delay in replication (red). Two chromosomes with normal replication timing are shown in grey.

