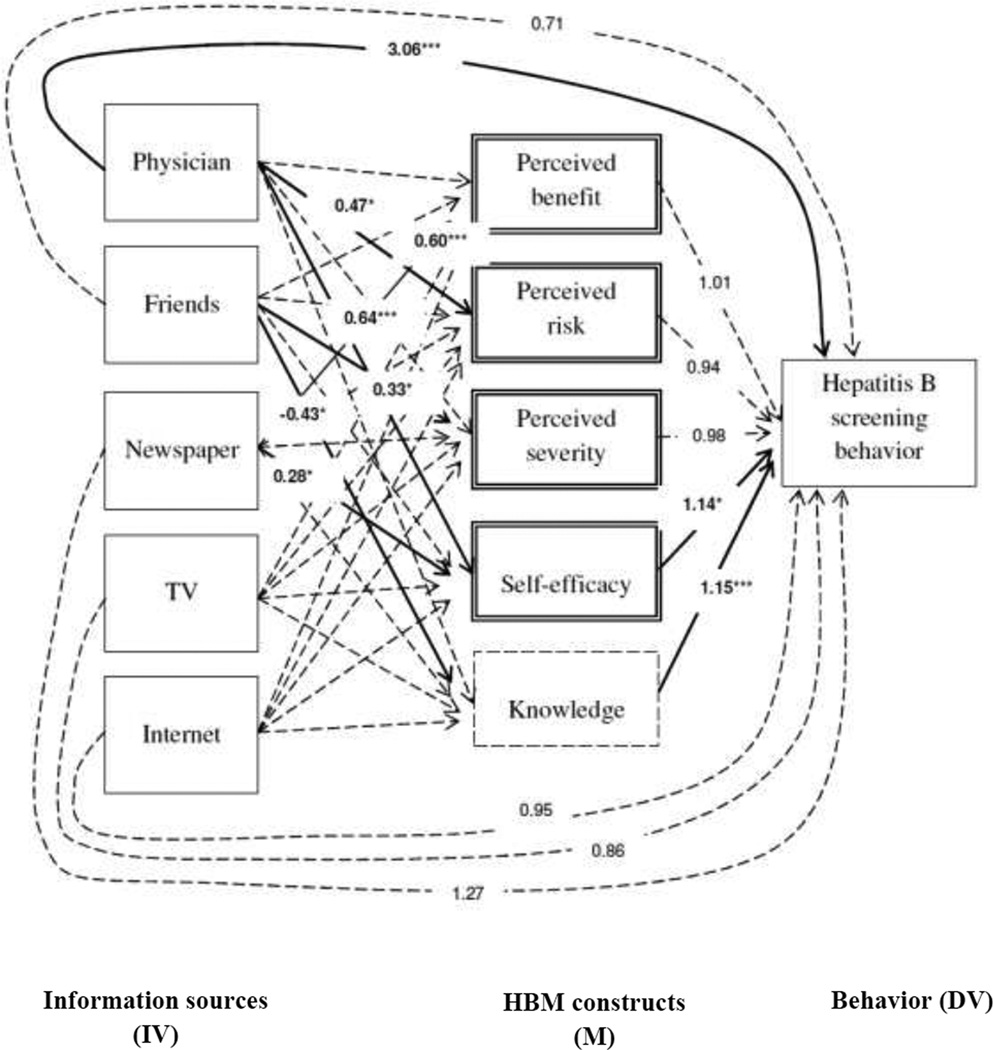
Figure 1. Path Analysis Model of HBV Screening with HBM Variables and Information Sources.
Note: The associations between IV and DV, M and DV are shown in odds ratios. On the other hand, the associations between IV and M are shown in linear regression coefficients. Due to the lack of space, only significant linear regression coefficients are shown here. Table 3 has all of the linear regression coefficients between IV and M, regardless of their significance. The significant associations are shown in solid lines; whereas insignificant associations are shown in dotted lines.
The Path analysis model included the following as control variables: age, sex, educational level, English proficiency, proportion of life in the U.S., health insurance coverage, and family history of HBV infection. Among these control variables, having a college education or above and living less than a quarter of life in the U.S. were associated with completing hepatitis B screening.
* p<0.05, ** p<0.01, *** p<0.001

