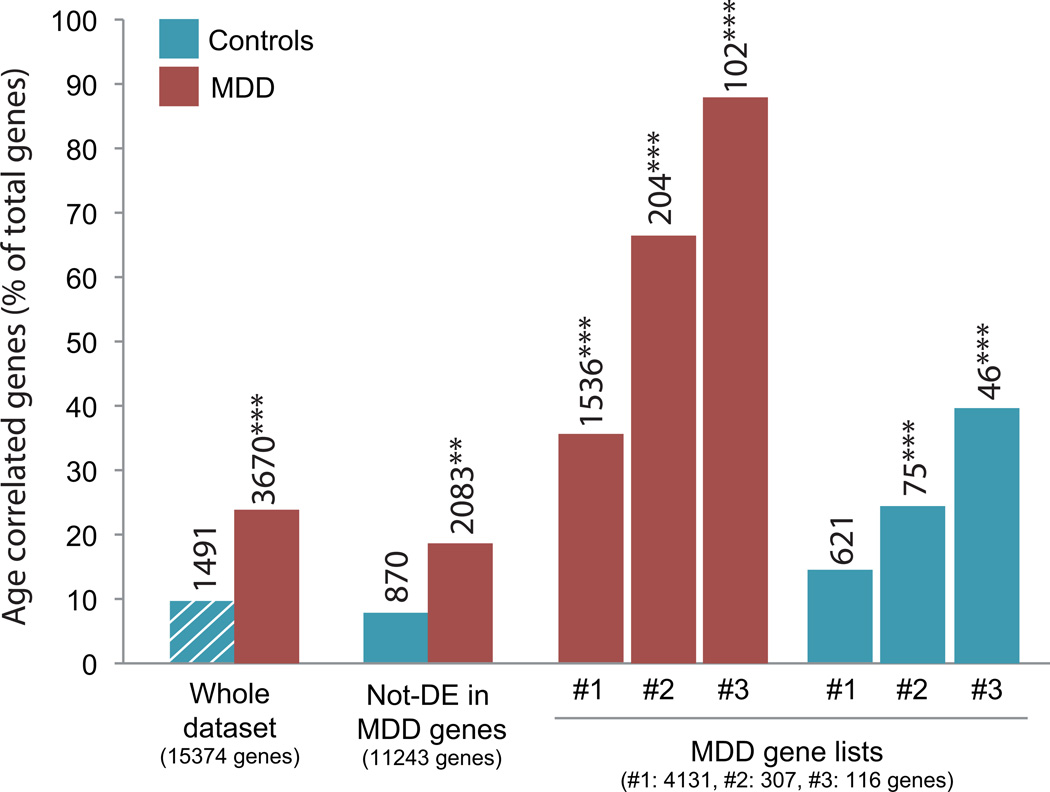
FIGURE 2. Increased numbers of age-correlated genes in MDD subjects.
The percentages of age-related genes (Y-axis) in MDD (red bars) and control subjects (blue bars) are displayed for various lists of genes with increasing stringengy for MDD effects (List #3 is the most stringent; see Methods). The numbers on top of bars represent the number of age-related genes. The numbers in parentheses at the bottom of the columns represent the number of genes in the corresponding gene lists. **p<0.01, ***p<0.0001 using Chi-square analyses, comparing the frequency of age-dependent genes in the different groups to the expected frequency, i.e. the frequency of age correlated genes observed in the control group (blue bar with white dashes). DE: differentially expressed.

