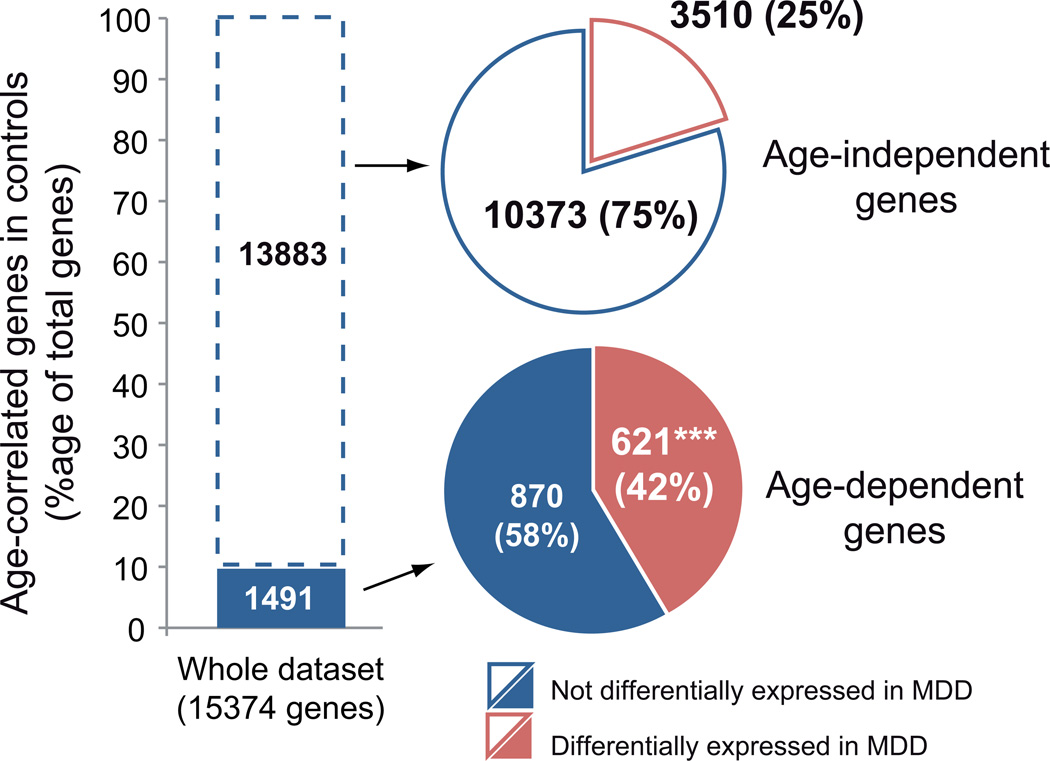
FIGURE 3. Over-representation of MDD effects in gene set displaying age-dependent changes in controls.
The histogram shows the relative proportion of genes showing age-effects in the amygdala of control subjects (Age-dependent, Dark blue, ~10%). The lower pie-chart indicates that 42% of the age-dependent genes in controls are also differentially expressed in MDD subjects (Based on List # 1, See methods). ***p<0.0001; Chi-square analysis comparing frequency of genes differentially expressed in MDD in the age-dependent genes selection compared to their frequency in the whole dataset. The upper pie-chart indicates that the frequency of MDD effect in the set of genes that are age-independent was nominally greater, but not significant different, from the control population.

