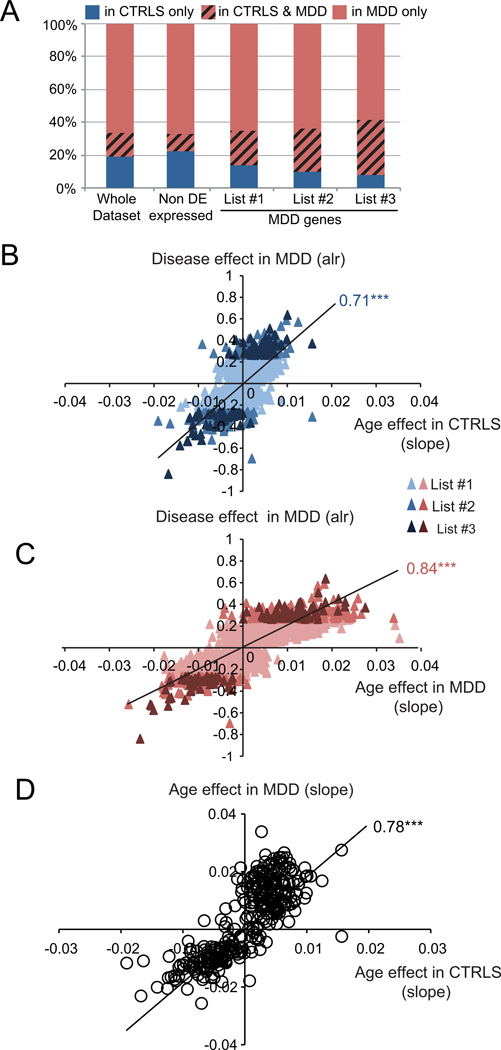
FIGURE 4. MDD-related gene changes are globally and positively correlated with age in MDD subjects, and are positively correlated with sub-threshold effects in control subjects.
(A) The relative proportion of genes correlated with age solely in controls (blue) decreases in gene lists with increasing stringency for statistical association with MDD. Red indicates proportion of genes with age effects solely in MDD subjects. The red blocks with black hashed lines indicate the proportion of genes displaying age-effects in both subject groups. (B, C) Correlation between the effect of MDD (Average log-ratio (alr) value of the MDD effect) and the age-related effect on gene expression ratio in controls (CTRLS) (B) and MDD subjects (C). Age effects were determined here using the slope of the linear regression of gene expression ratio as a function of age. Note that the unit of slope values (x-axis) correspond to changes per year in expression values that are normalized to the mean expression of the respective genes, as in Figure 1. So a value of 1 corresponds to the mean expression value, and slope values ranging from 0.01 (in controls) to 0.03 or 0.04 (in MDD) correspond to ~1% or 3–4% of change per chronological year. (D) Correlation of effect of age in controls with effect of age in MDD population. The values in graphs B–D are Pearson Correlation factors. ***, p<0.0001.

