
Figure 2. Neuronal response in fasted as compared to fed state in obesity-resistant (OR) individuals.
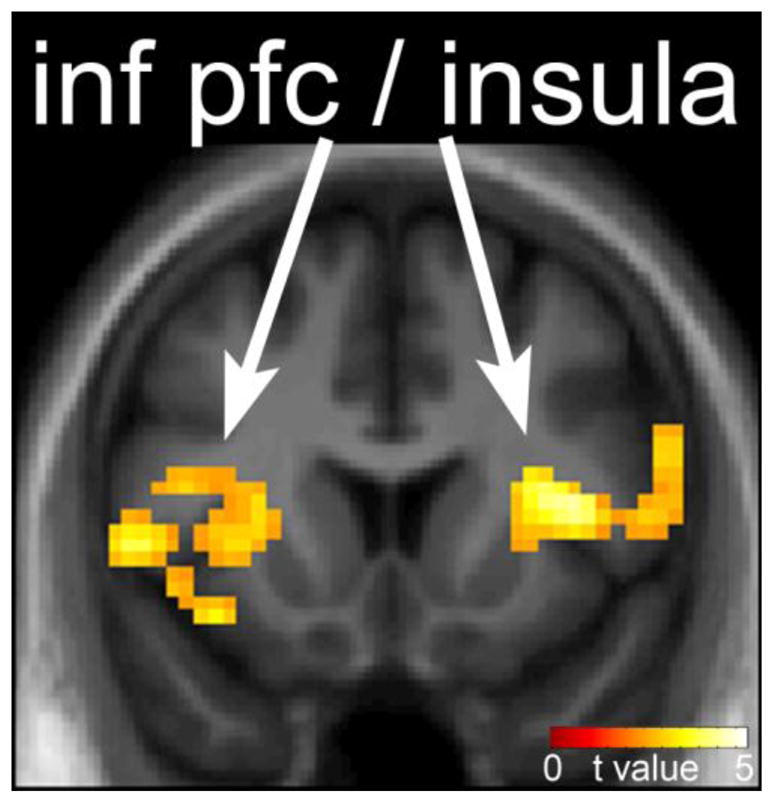
The difference in neuronal response to foods of high hedonic value in the fasted as compared to fed state in OR individuals is shown. Reduced response in the insula and prefrontal cortex is observed after the test meal. Statistical maps thresholded at a voxel-wise threshold of p < 0.01 and a cluster-level false discovery rate (FDR) threshold of q < 0.05 and overlaid onto the group averaged anatomical image. Data are shown in the neurological convention (right hemisphere on the right).