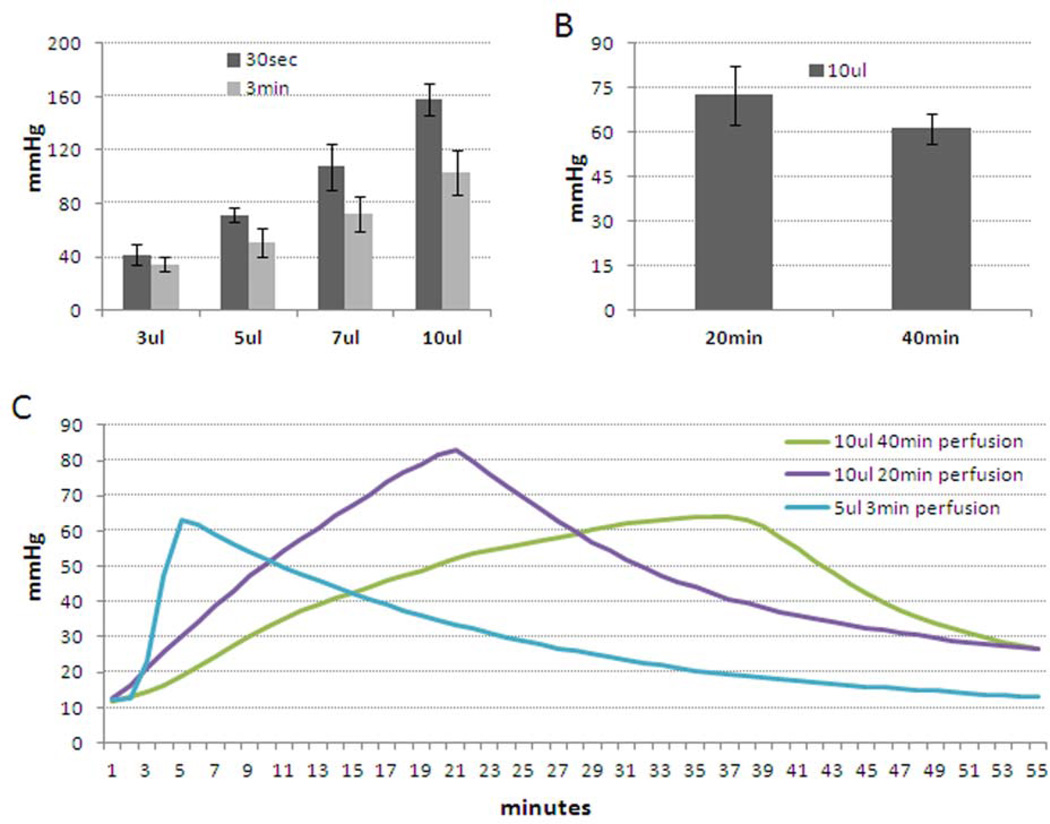
Figure 5. Changes of intraocular pressure of mouse eyes during infusion.
Two needles were inserted into anterior chambers of living mouse eyes. One needle filled with PBS was connected to a one-mL syringe pump, and different volume of PBS at various flow rates were infused into anterior chambers. At the same time, a secondary needle which was connected to a pressure transducer recorded changes of IOP over time. A) Peak IOP recorded following infusion of different volumes of PBS over 30 seconds or 3 minutes (n=6–9). B) Peak IOP following infusion of 10 µl PBS over 20 or 40 minutes (n=3). C) Representative IOP profiles recorded during infusions over 3, 20 or 40 minutes using C57BL/6 mice (12–30 weeks old).

