
Figure 6. Variance in V-index for networks with 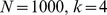 and varying clustering coefficients (a) and varying assortativity coefficients (b).

The variance is based on ten different realizations of the network for each value of clustering and assortativity coefficient, and the error bars represent the standard error.