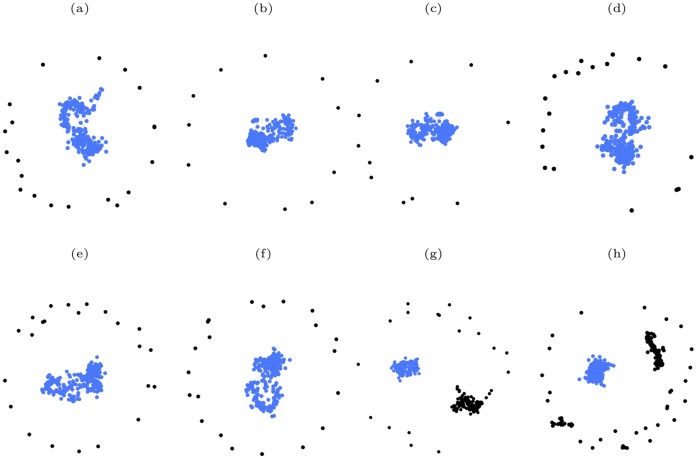
Figure 12. A comparison of the structure of the neural network of C. elegans when 20% of the vertices have been removed according to both simultaneous and sequential attack, in decreasing order of degree, eigenvector, closeness and betweenness centrality measures.
(a)(b)(c)(d) simultaneous attack based on degree, eigenvector, closeness and betweenness centrality measures, respectively; (e)(f)(g)(h) sequential attack based on degree, eigenvector, closeness and betweenness centrality measures, respectively. For clarity, the vertices in the largest component are colored blue, while all other vertices are colored black. The relative size of the largest component,  , for the different cases are: (a)
  ; (b)
; (b)  ; (c)
; (c)  ; (d)
; (d)  ; (e)
; (e)  ; (f)
; (f)  ; (g)
; (g)  ; (h)
; (h)  .
.

