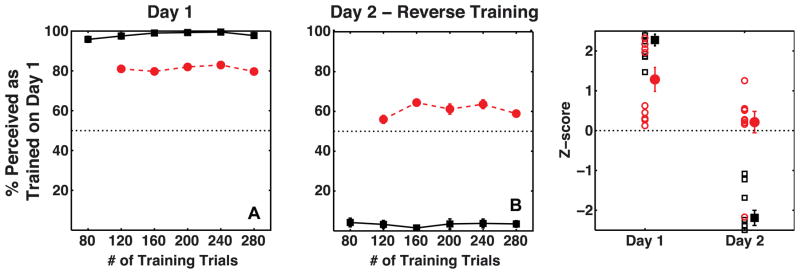
Figure 3.

Average percent perceived as trained on Day 1 by observers (N=10) on Training trials (black squares) and Test trials (red circles). Panels A and B show data as a function of the number of training trials on Day 1 and Day 2, respectively. Panel C shows the same data as a Z-score measure for the entire session, with a separate marker for each subject. The mean of the data is plotted with a slight horizontal shift to prevent individual data being occluded. The error bars show the standard error of the mean.
