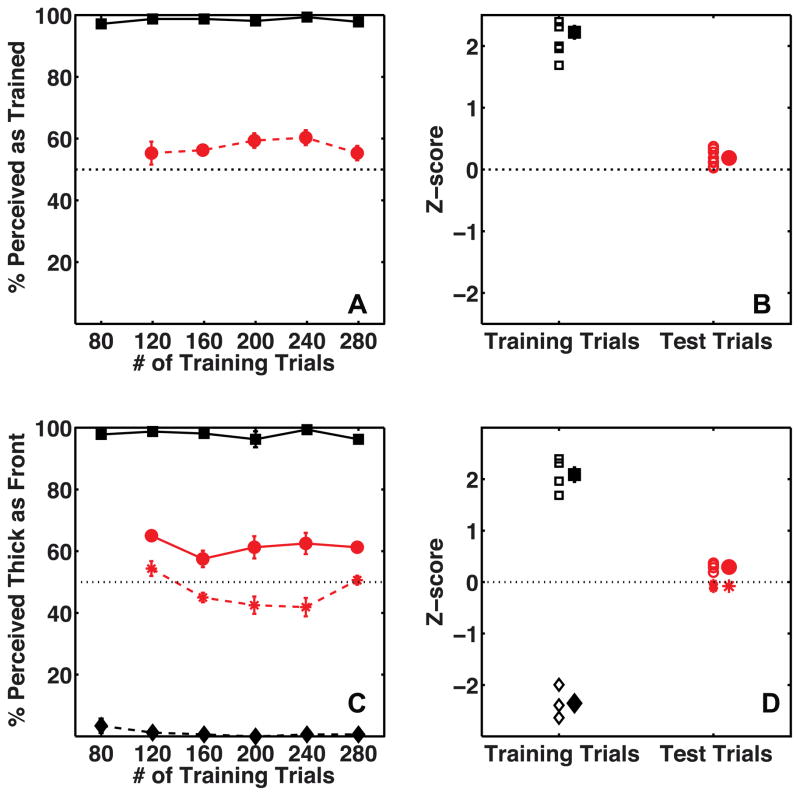
Figure 6.
A) Average percent perceived as trained by observers (N=8) on Training trials (black squares) and Test trials (red circles) as a function of the number of training trials. B) The same data is shown as a Z-score measure for the entire session, with a separate marker for each subject. C) Average percentage of trials seen as having thick gratings as closer observers (N=8) on Training trials and Test trials as a function of the number of training trials. The black squares and red circles represent observers trained with thick gratings as front contingency while the black diamond and red stars represent observers train with thin gratings as front contingency. D) The same data is shown as a Z-score measure for the entire session, with a separate marker for each subject. In Panels B and D the mean of the data is plotted with a slight horizontal shift to prevent individual data being occluded. The error bars show the standard error of the mean.

