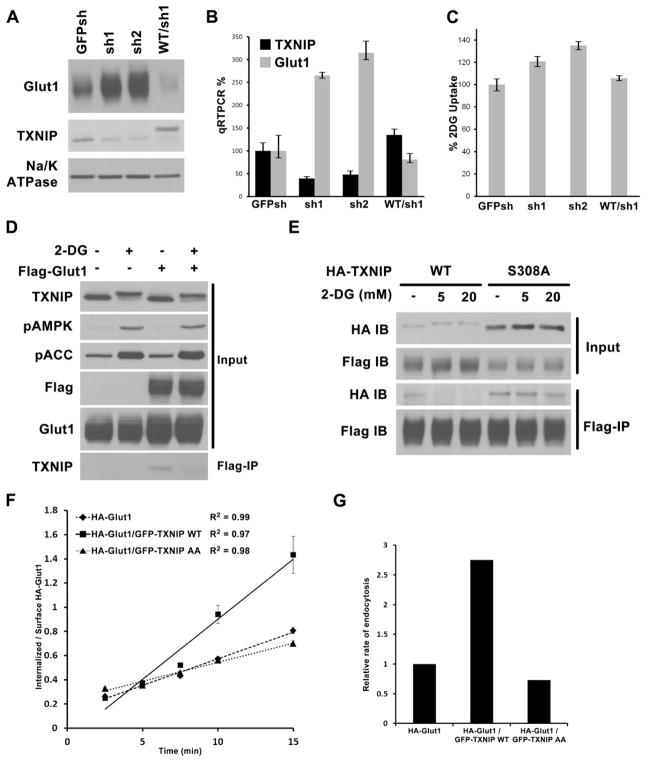
Fig. 4. TXNIP regulation of Glut1.
Stable HepG2 cells were generated expressing control shRNA construct (GFPsh), or TXNIP knock-down shRNAs (sh1 and sh2), or knock-down cells reconstituted with HA- WT TXNIP construct that is resistant to sh1 (WT/sh1). Cells were examined for (A) Glut1 protein levels by Western blot, (B) Glut1 mRNA levels by qRT-PCR normalized to GFPsh control cells, and (C) relative rate of glucose uptake in media with 2mM glucose using trace amount of 3H-2DG, normalized to GFPsh control cells. The average values of triplicate experiments (±STDV) are reported. (D) HepG2 control cells and cells stably expressing Flag-Glut1 were treated with either water or 25mM 2DG for 10′. Flag–tag IP was carried out with the cell lysates to test interaction with endogenous TXNIP. (E) HepG2 cells stably expressing both Flag-Glut1/HA-TXNIP WT or both Flag-Glut1/HA-TXNIP S308A mutant were treated for 10′ with water, 5mM 2DG, or 20mM 2DG. Flag-tag IP was carried out to check for the effect of S308 phosphoryaltion on Glut1/TXNIP interaction. (F). HA-Glut1 endocytosis assay in TRVb-1 cells transiently transfected with HA-Glut1, HA-Glut1/GFP-TXNIP WT or HA-Glut1/GFP-TXNIP AA constructs. Cells were incubated with antibody against HA-tag on the first exofacial loop of Glut1 at 37°C and fixed after each time point. The cell surface HA-Glut1 is labeled with Cy5 secondary antibody while the endocytosed HA-Glut1 is labeled with Cy3 secondary antibody. The ratio of Cy3-to-Cy5 fluorescence signal was reported as the ratio of internalized-to-surface HA-Glut1 and plotted versus time ± SEM. R2 of the linear regression lines are shown. The data are from a representative experiment. (G). Relative endocytosis rates calculated from the slopes of linear regression from data in (F) normalized to HA-Glut1 alone control.

