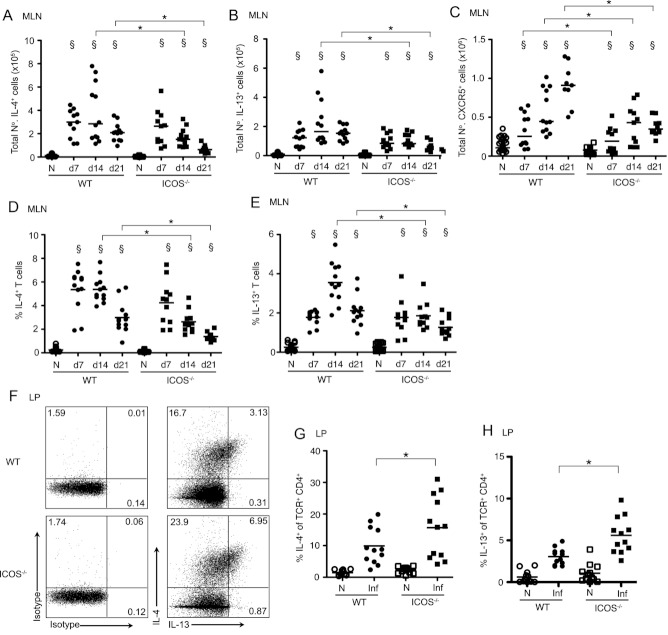
Figure 4.
ICOS deficiency results in increased Th2 cytokine production by LP CD4+ T cells. WT (circles) and ICOS−/− (squares) mice were infected with H. polygyrus and flow cytometry was used to quantify the secretion of IL-4 and IL-13 by MLN and LP CD4+ T cells. (A–C) The number of MLN CD4+ T cells producing (A) IL-4 and (B) IL-13, and (C) expressing CXCR5. (D, E) The percentage of MLN CD4+ T cells producing (D) IL-4 and (E) IL-13. (F) Representative staining for IL-4 and IL-13 on LP CD4+ T cells. (G and H) Percentage of LP CD4+ T cells producing (G) IL-4 and (H) IL-13. Symbols denote individual naïve (open symbols) and infected (closed symbols) animals and lines represent means. (A–F) Data shown are pooled from three independent experiments. *denotes significant strain effect and § denotes significant infection effect (p < 0.05, Tukey HSD, ANOVA performed using combined data from three separate experiments).

