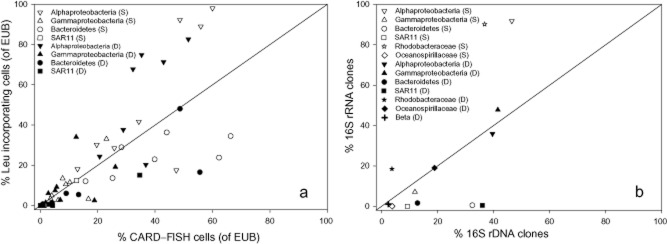
Fig. 4.

Relative contribution of specific bacterial groups to the bulk bacterial abundance determined by (a) CARD–FISH versus the percentage of cells of the respective bacterial group taking up leucine assessed by MICRO–CARD–FISH (determined in the whole transect) and by (b) 16S rDNA versus 16S rRNA clone libraries (determined at St. 5). S denotes surface samples and D deep-water samples.
