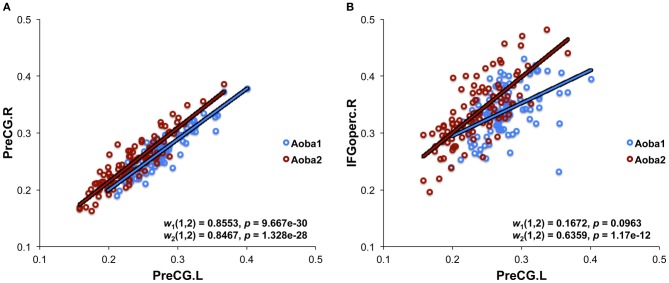
Figure 1.
Structural connectivity derived from the measurement of regional gray matter volume. (A) The structural connectivity between the bilateral precentral gyrus (PreCG). (B) The structural connectivity between left PreCG and the left opercular part of the inferior frontal gyrus (IFGoperc). The plots indicate Pearson's correlation coefficients [wN(i, j)] between two brain regions (i and j) using the measurement of regional gray matter volume, which was corrected by a linear regression analysis to remove the effects of total gray matter volume, age, sex, and age-by-sex interaction. The data from both the baseline (Aoba1, N = 1) and follow-up (Aoba2, N = 2) scans are shown.

