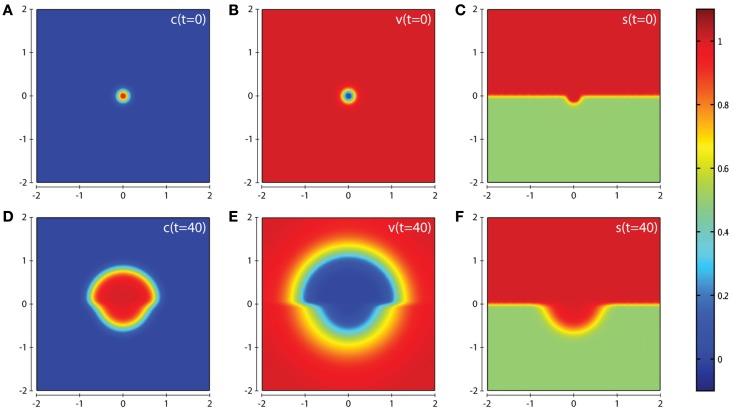
Figure 3.
Plots showing the simulation results obtained in a two-dimensional domain where asymmetric invasion of the ECM is achieved by the cancer cells. We use the matrix suitability modifier s to represent a medium with neutral abilities in the upper half of the region (s = 1; red) and with a reduced, moderate, suitability for invasion in the lower half (s = 0.5; green). Plots (A–C) show the initial values of the cancer cell and ECM densities as well as the initial layout of the matrix suitability modifier with (D–F) showing their resultant profiles at t = 40 (corresponding to ∼4.6 days). Simulations are performed using the baseline parameter set.

