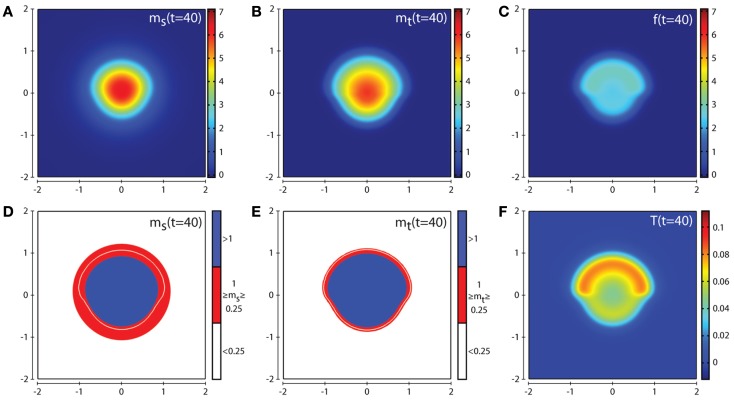
Figure 5.
Plots showing the simulation results obtained in a two-dimensional domain where asymmetric invasion of the ECM is achieved by the cancer cells. The concentrations of MMP-2, MT1-MMP, the intermediary complex f, and TIMP2 at t = 40 (corresponding to ∼4.6 days) are shown in plots (A–C,F) respectively. Plots (D,E) show the MMP-2 and MT1-MMP concentrations at t = 40 with appropriate thresholds near the invasive front of the cancer cell invasion. The white contour line shows the cancer cell density at level 0.01 chosen to represent the maximum extent of invasion. Simulations are performed using the baseline parameter set.

