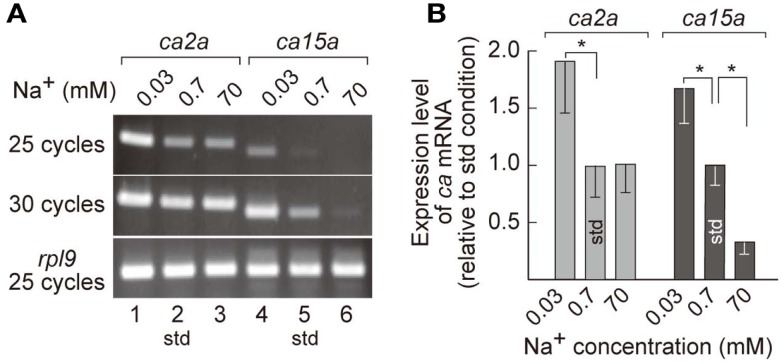
Figure 3.
Salinity-dependent expression of ca2a and ca15a in zebrafish larvae. (A) Expression level of ca2a and ca15a in different salinity medium was analyzed by RT-PCR with RNA extracted from 7-dpf larvae reared in 0.0003% (0.03 mM Na+), 0.006% (0.7 mM Na+), or 0.6% (70 mM Na+) salt water. rpl9 (ribosomal protein L9 mRNA) was used as expression control. (B) Levels of ca2a and ca15a mRNA expression estimated by quantitative RT-PCR (qPCR) (n = 4). Data are expressed relative to the value obtained under the standard culture conditions (std; 0.7 mM Na+). *p < 0.05 in the comparison with the standard culture condition (Student’s t-test).

