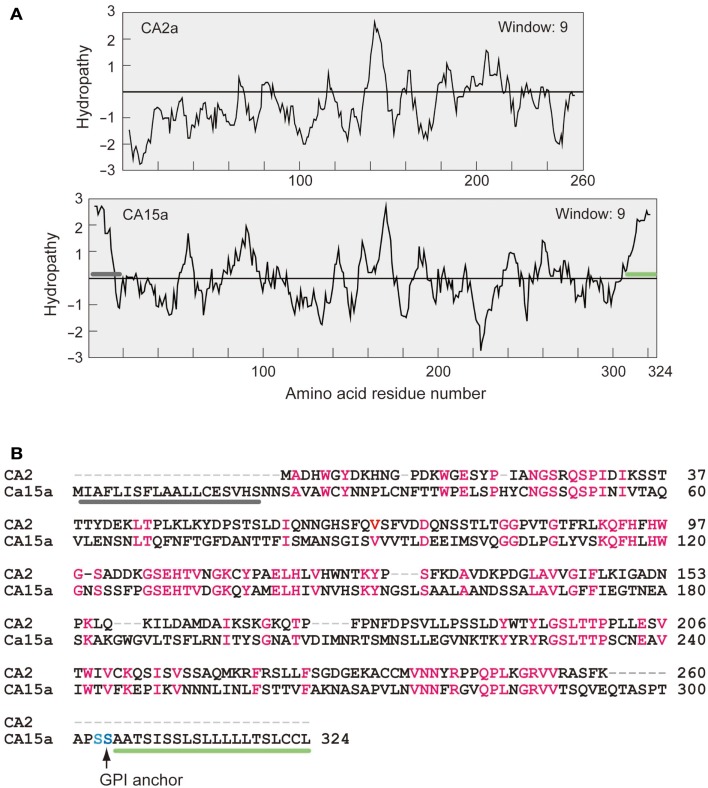
Figure A3.
Hydropathy profiles (A) and amino acid alignment (B) of zebrafish CA2a and CA15a. (A) Kyte–Doolittle hydropathy plots generated by using a window size of 9 (Kyte and Doolittle, 1982). Gray bar represents a putative signal peptide and green bar, a hydrophobic glycosylphosphatidylinositol (GPI)-anchor signal. (B) Comparison of amino acid sequences of zebrafish CA2a and CA15a. Identical residues are highlighted in red. GPI anchor site is indicated by a vertical arrow. Gray and green bars correspond to those in (A).

