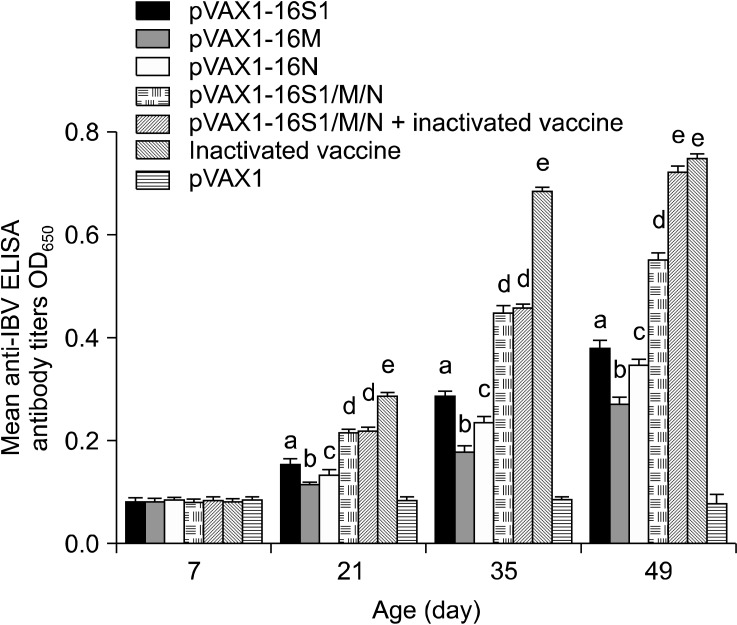
Fig. 2.
Mean ELISA antibody titers for the different groups immunized with different vaccines. Data are expressed as the mean ± SD for 10 chickens in each group. Each column is labeled with a letter. Different letters indicate that the differences between individuals in that day group in antibody titers are significant (p < 0.01). Absence of a letter indicates that no significant differences (p > 0.05) were observed between any of the time points. Although not indicated in the graph, the differences between corresponding treatments from different day groups are significant (p < 0.01).

