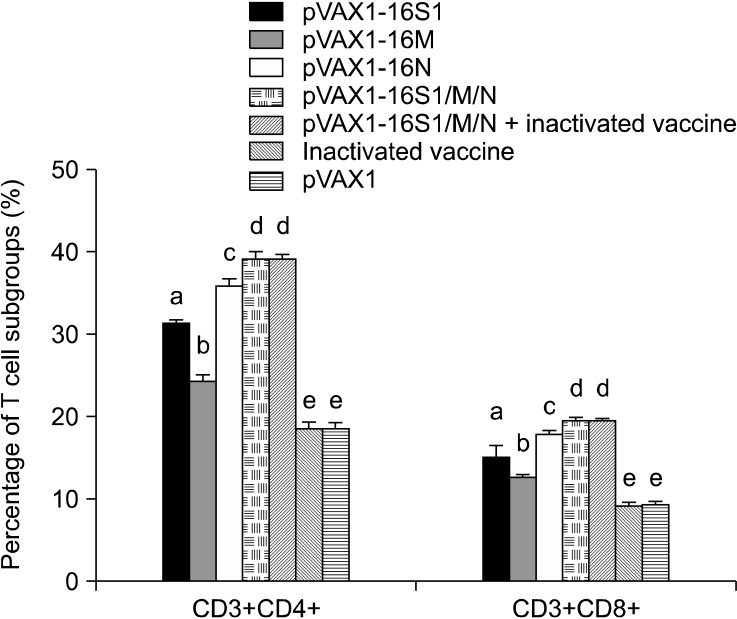
Fig. 4.
Percentages of CD3+CD4+ and CD3+CD8+ T lymphocytes in the different groups of chickens. Columns are labeled with letters. Different letters indicate statistically significant differences (p < 0.01) while letters in common indicated that no significant differences (p > 0.01) were observed in each T cell subgroup.

