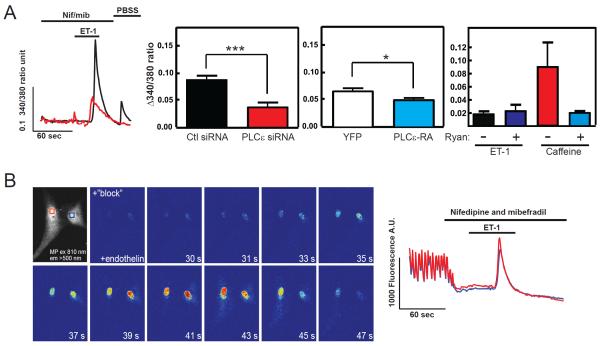
Figure 5.
PLCε is involved in regulation of nuclear Ca2+ elevation. (A) NRVMs were loaded with Fura2 and the Fura2 ratio in the nucleus was measured with time after 200 nM ET-1 addition in the presence of a 10 μM nifedepine/ 2 μM mibefradil. Left panel is a representative trace from two individual cells. Middle left panel is the combined data from multiple cells comparing Ctl siRNA and PLCε siRNA treated NRVMs, ***p<0.005. Middle right panel is the combined data from cells expressing either YFP or the YFP-RA domain to disrupt mAKAP scaffolding. Both sets of data are from 4 independent experiments from cells isolated from 4 different NRVM preparations with >10 cells for each coverslip and 3 coverslip averages for each for each NRVM preparation, *p<0.05 calculated based on an average of 12 coverslip averages for each condition. Right panel shows that the ET-1-dependent nuclear Ca2+ response is not blocked by Ryanodine but the Caffeine response is (This experiment was repeated with 2 separate sets of NRVMs, data is representative of one experiment with 30 cells each condition). All data are +/− SEM. (B) 2-photon microscopy was used to measure nuclear Ca2+ levels in fluo-4 loaded NRVMs. Cells were perfused with imaging buffer containing 10 μM nifedepine and 1.8 μM mibefradil to block Ca2+ transients associated with voltage-dependent Ca2+ release followed by addition of 100 nM ET-1. Individual panels show the level of Fluo4 fluorescence at the indicated times (See Supplemental Movie 1). The boxes in the first panel correspond to the areas measured shown in the traces shown on the right.

