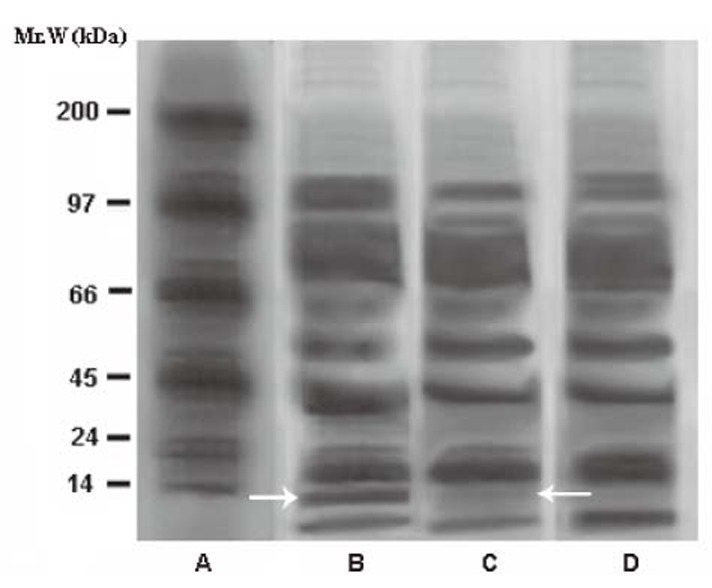
Figure 5.

The effect of application of SNP “pad” on the intensity of the dermcidin band on SDS-PAGE of the plasma from T1DM subjects for 24h. Panel A: shows molecular marker protein bands; Panel B represents the cell free plasma from T1DM subjects before the application of the dermal SNP “pad”; Panel C indicates the cell free plasma from the same T1DM subjects after the application of SNP “pad”; Panel D: shows the cell free plasma from normal volunteers; The white arrows indicate the dermcidin bands in SDS-PAGE. The white arrow in Panel B indicates dermcidin band before the application of the SNP “pad” and the white arrow in Panel C represents dermcidin band after the application of the SNP “pad”. The intensity of the dermcidin bands before and after the application of SNP is expressed in pixel units. The figure is a typical representative of at least 6 similar experiments using plasma from 6 different subjects in each group.
