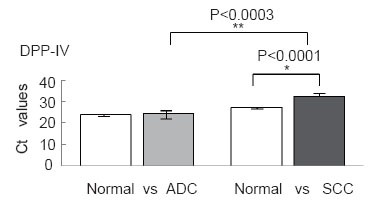
Figure 6.

Expression of DPP-IV in ADC and SCC patients measured by quantitative RT–PCR. Ct values with standard deviations are given. Differences in gene expression levels between normal tissue and ADC and between normal tissue and SCC were analyzed with Student’s t test. *P<0.0001, **P<0.0003.
